← Back to portfolio
Streamlit Data Dashboard Demo
Software Data In Progress
2026
Portfolio
Role: Sole Developer
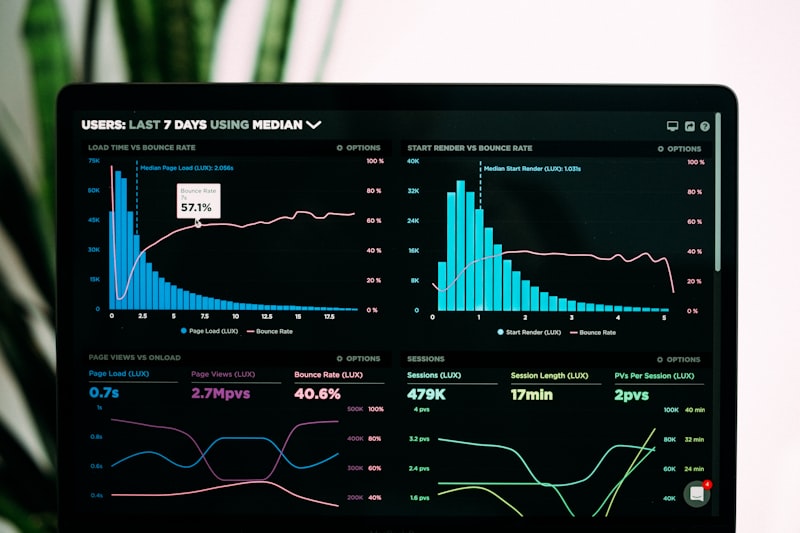
Interactive data visualization and dashboard application built with Python and Streamlit — demonstrating data analysis, exploration, and presentation skills.
python data-visualization streamlit dashboard
Stack
Python Streamlit Pandas Plotly
Platform
Linux
This demo explores how quickly Streamlit can turn analysis code into an interactive interface. The focus is on presenting data clearly, with enough interactivity to support exploration without turning the project into a full custom frontend.
It is still in progress as a portfolio piece and a proving ground for lightweight dashboard ideas.
Interested in collaborating?
I'm always open to discussing new projects, ideas, or opportunities.
Reach out